
Photo by Claudio Schwarz on Unsplash
Debugging Tips: Javascript 2
Seeing your source files on chrome helps
Hey guys So after my first debugging tips, I realized there are some additional things I could add that does help and also examples where we can clearly see that the editor will not show us the bugs but the Chrome Dev tools do.
I also want to share an important feature in Chrome Dev tools that will help you when debugging your app and you want to see the source code on the browser.
How to show source files when debugging on chrome:
- Firstly you wana open your chrome dev tools, open Chrome -> press CTL + SHIFT + I or go to settings then More Tools then Developer Tools
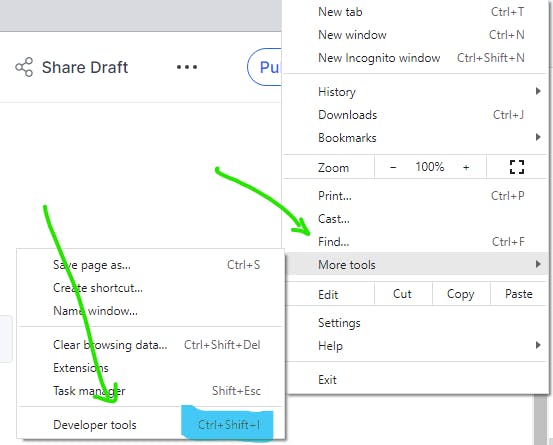
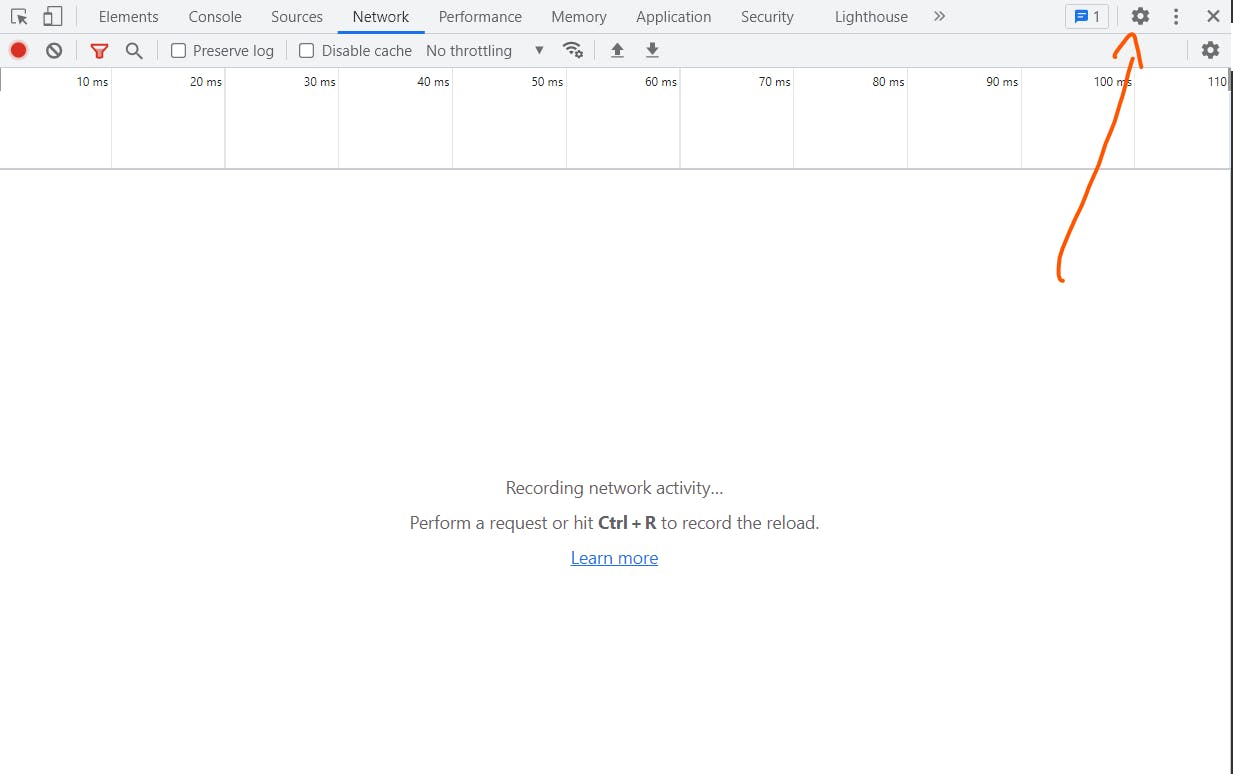
- Next, you want to open the "big gear" or high-level settings for the dev tools use the example bellow:
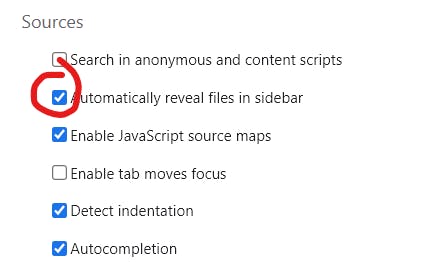
- When the settings have opened go to Sources and enable **Automatically reveal files in the sidebar with the example below.
-Open and close the Dev tools/ rerun your project, then when you need to debug you can actually open the file and see its activity at run time.
- Press the 3-dots & select Open file option or options using example bellow:
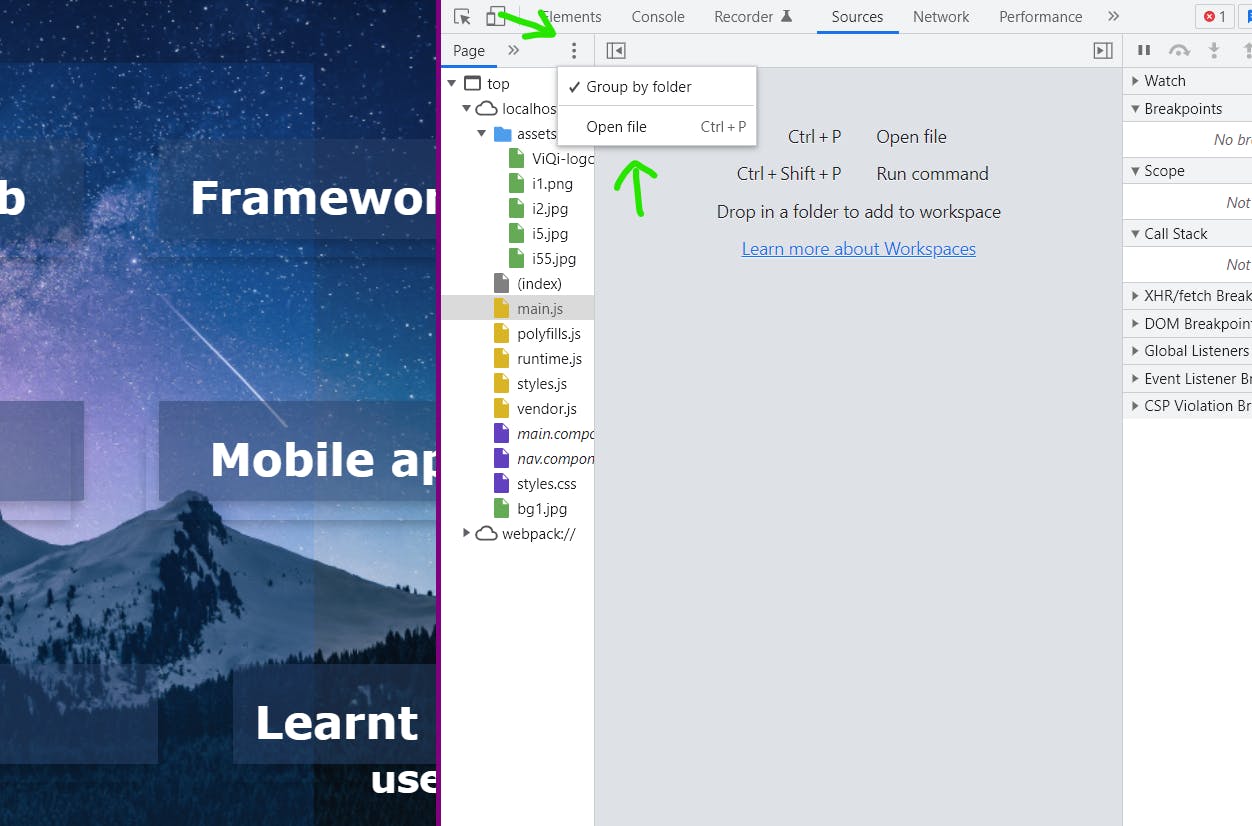
- This will allow you to select the file you intend to debug and I made example of how they show on my chrome, showing dropdown with the files in the current project I am working on.
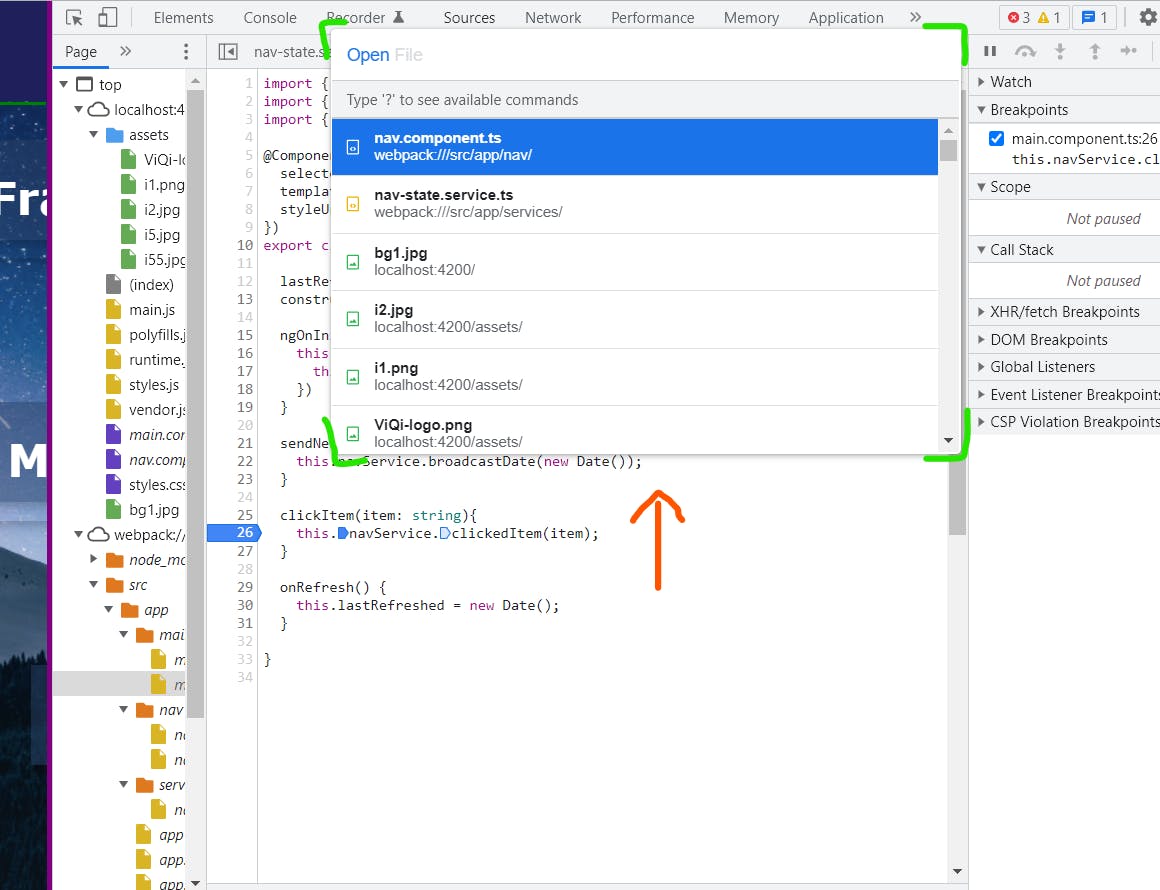
- You will have to select the files you want to work with and I advise you don't choose the entire folder but select the files you currently working on or the module you working with at the time because of space and you want to keep it uncluttered.
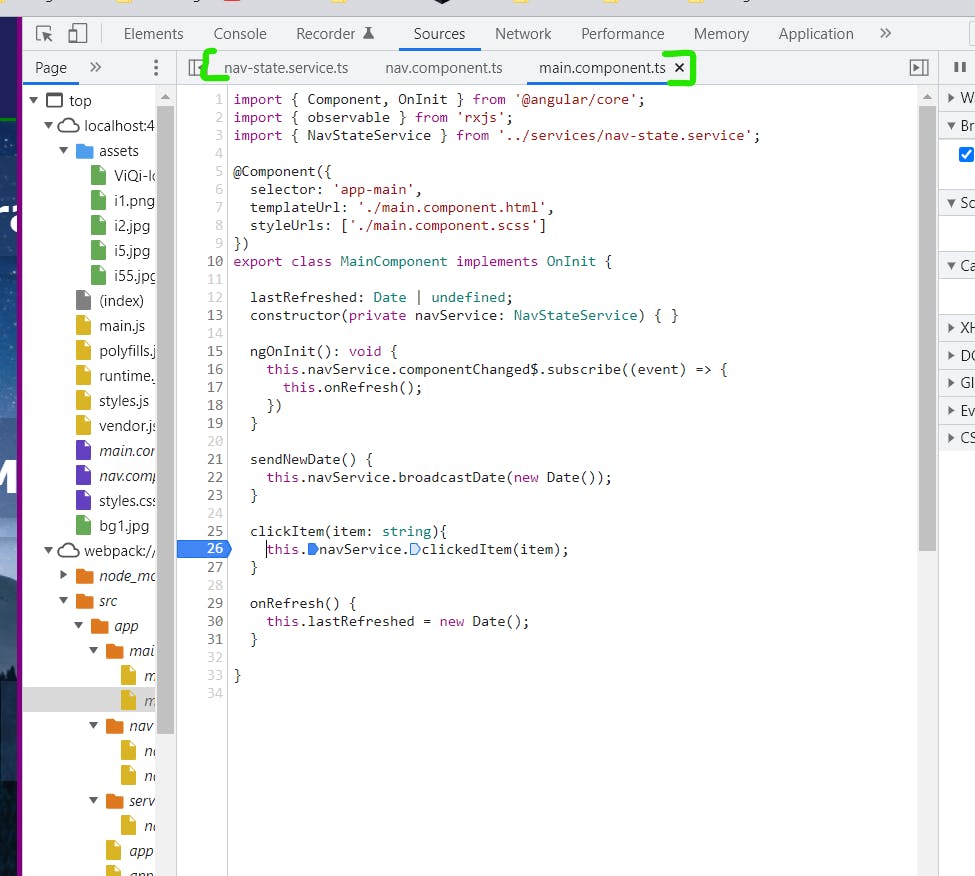
This image shows the files I have selected and where they will show and from here I can put breakpoints %[line 26] and see the result of certain return statements or where the code produces null reference errors or anything of that sort.
Why is using this important for debugging?
That's a good question, so sometimes when you write javascript code on your code editor and the errors or mistakes you make like spelling errors in the HTML or even Typescript will not show until run time.
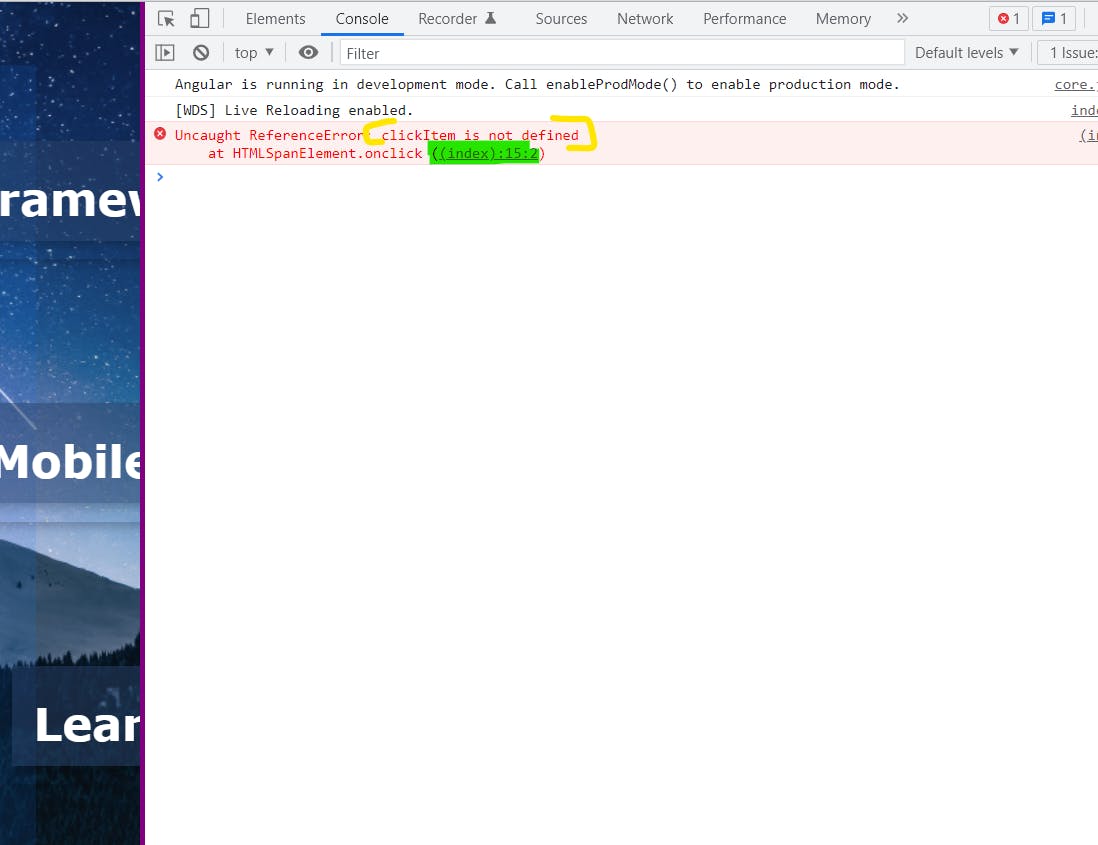
- This is an example where I created an error where I had misspelled the name of the function i want to call when I handle the click event in the HTML, as much as rubber duck debugging would have worked, it could take hours, so this is an example where this skill will help by opening the source code on the browser and seeing the problem.
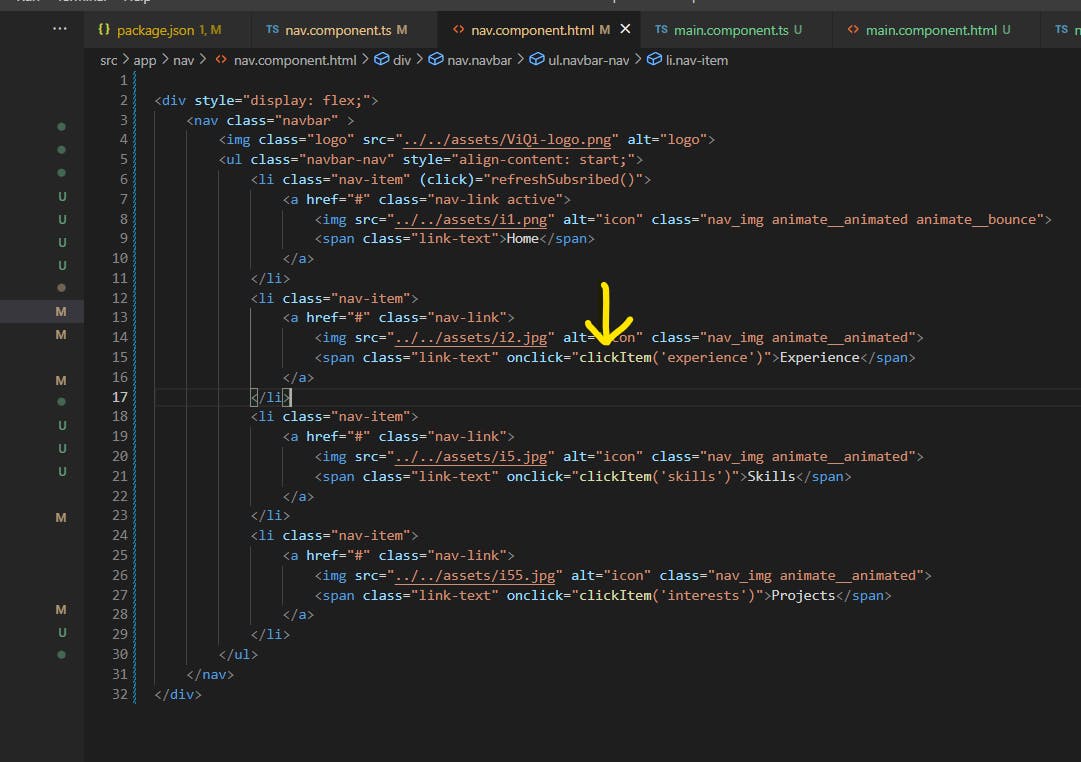
- So from the HTML code you can see that we calling the clickItem() function. but we have a problem, that's not the name of the function in TS and I couldnt see from the code.
So please think about it, check it out on your next debugging sesion, and tell me what you think and if it brings value to your dev process. Good luck coder!!
Thank you.

